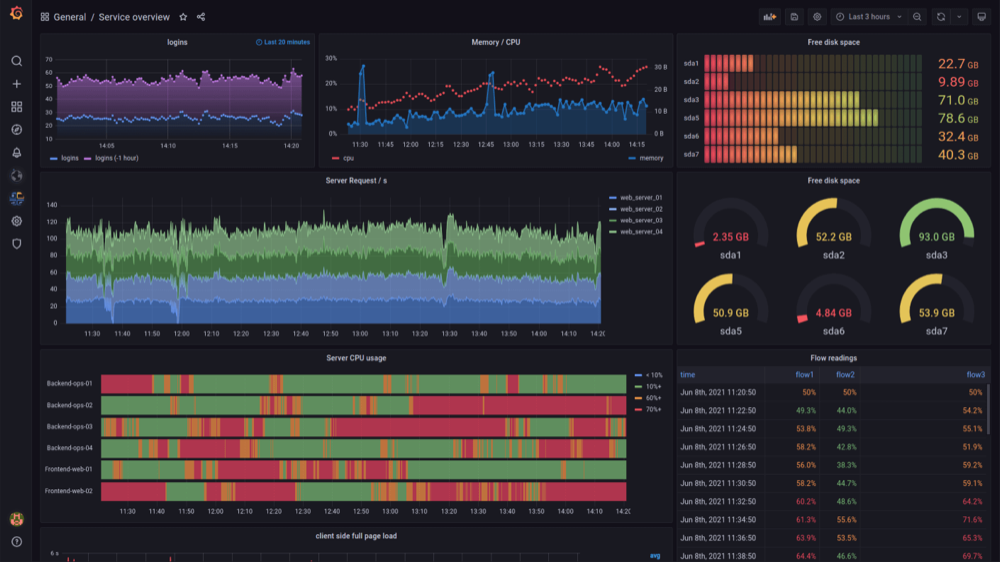
Since the advent of cloud computing, IT teams have focused on using application performance monitoring (APM) to understand application performance issues. This frameworks aggregates sampled application and system data to provide snapshots and compares them against established KPIs; this is known as telemetry. While this form of telemetry has been sufficient to handle relatively static development environments and resources that are clearly defined, it doesn’t adequately perform against today’s modern development frameworks that incorporate continuous integration and deployment as well as cloud-native features such as serverless, microservices, and containers that are often rapidly deployed and discarded in a matter of seconds. Grafana Labs has built a cloud-native observability and monitoring platform that allows enterprises to manage their evolving development environments from a single dashboard that’s built to pinpoint every facet of the software development life cycle by incorporating individual and disparate data from across the entire stack. Users are able to access complete information related to logs, metrics, traces, and dependencies through the company’s signature visualization Grafana dashboards. Grafana offers both self-managed and fully-managed solutions, enabling DevOps teams to isolate issues in both test and production environments across the organization’s infrastructure whether issues surface on the front or backend, middleware, or even related to hardware.
AlleyWatch caught up with Grafana Labs CEO and Cofounder Raj Dutt to learn more about the business, the company’s strategic plans, latest round of funding, which brings the total funding raised to $535.2M, and much, much more…
Who were your investors and how much did you raise?
This is a $240M Series D round led by GIC, Singapore’s sovereign wealth fund. We’re grateful to all of our other existing investors – Sequoia Capital, Coatue, Lightspeed Venture Partners, and Lead Edge Capital – who also participated in this round. And J.P. Morgan joined this round as a new investor as well.
 Tell us about the product or service that Grafana Labs offers.
We provide our users with a composable monitoring and observability platform that allows them to visualize and alert on all their disparate data in our very popular Grafana dashboards. Observability has become really important, partly due to the acceleration of digitization during the pandemic. Now everyone expects apps to work instantly, whether it’s buying a stock or crypto, ordering a car, getting lunch or dinner. Consumers expect maximum uptime and speed. And organizations use Grafana to make sure all of their applications and services are working. For some of our biggest customers, downtime can cost millions of dollars per minute – and some of their users will simply switch. Our observability offering can be run fully managed with Grafana Cloud, or self-managed with Grafana Enterprise Stack.
What inspired the start of Grafana Labs?
It all started with a personal project our cofounder, Torkel Ödegaard, created over the winter holiday break in 2013. He wanted to make time-series data accessible to a wider audience via a tool that lets you easily build interactive dashboards and graphs. The Grafana open-source project quickly went viral, and it is still at the heart of the observability platform that Grafana Labs provides today.
How is Grafana Labs different?
The entire monitoring and observability space has taken off, and we aren’t alone at all in benefiting. But there’s one big difference in our approach: We have looked at the challenge from the perspective of our users, trying to build the products that will best help our customers do the work that they need to do regardless of what tools they are using. This is our “big tent” strategy: Our users can go to Grafana to leverage all of their tools; in a Grafana dashboard, they can look across many of their vendors all in one place. We aren’t telling them to rip out the investments they’ve already made and the solutions that already work. We want to enable our customers to have the best technology, and visibility into it, so they can operate efficiently and scale to their highest potential.
What market does Grafana Labs target and how big is it?
Grafana Labs finds itself in a variety of markets. The Observability market is probably one of the largest that some estimate as $18-20B. We’ve also built a growing customer base from the IoT market since they use Grafana to stream real-time sensor data to dashboards too. Really any place people need operational dashboards, we are finding tremendous momentum.
What’s your business model?
Grafana itself became ubiquitous because of our open source go-to-market motion, where we develop both open source and Cloud (we offer a robust free plan) offerings that reduce the friction and adoption costs. Our primary focus is to help users be successful on our open source and Cloud offerings and then to differentiate with value-added commercial capabilities that range from support and enhanced security to enterprise plugins and horizontally scalable and efficient logging and metrics solutions.
What are your post-COVID office plans??
As a remote-first company from Day 1, we have employees working from 40+ countries on 6 continents. We’ll be sticking with this model, which has allowed us to secure the best talent wherever they live around the world.
What was the funding process like?
We have amazing relationships with our investors and because of our performance (both in customer adoption and revenue), we found that they approached the funding process much more like a mutual partnership. We all see a fantastic long-term opportunity for Grafana Labs.
What are the biggest challenges that you faced while raising capital?
To be honest, we’d rather be spending all our time focusing on our users and customers, so raising capital can be a distraction. We are lucky that the process was fast and mostly frictionless, allowing us to get back to our core business.
What factors about your business led your investors to write the check?
To us, the fact that all of our existing investors participated in this Series D, just 7 months after the last round, is an amazing expression of their belief in our team, our product strategy and execution, and our business. J.P. Morgan also joined this round because we demonstrated strong growth in both our product adoption and revenue.
What are the milestones you plan to achieve in the next six months?
Our plans are simple: aggressively deliver on our product roadmap and our commitment to embracing the big tent — enabling our users to compose and visualize data from any source — while continuing to build out modern observability capabilities across metrics, logs, tracing and more. We are committed to the continual release of impactful open-source software, bringing many new capabilities to market, and constantly listening to the community and our customers to drive innovation.
Our plans are simple: aggressively deliver on our product roadmap and our commitment to embracing the big tent — enabling our users to compose and visualize data from any source — while continuing to build out modern observability capabilities across metrics, logs, tracing and more. We are committed to the continual release of impactful open-source software, bringing many new capabilities to market, and constantly listening to the community and our customers to drive innovation.
What advice can you offer companies in New York that do not have a fresh injection of capital in the bank?
The biggest learning experience for me, from Grafana Labs and my last company, is that it’s all about your team, your people and making customers successful. As an entrepreneur or founder, you’ve probably got some unique skills and it’s a baseline for success, but my advice to any company is to build a team around you. It’s all about the team that you build and if you can create the right alignment and culture.
Where do you see the company going now over the near term?
We are hyper-focused on bringing our users the most scalable, cost-efficient observability stack, whether it’s all open source on-premises or in the Cloud. We just launched Grafana Mimir last week as an open-source project, and it actually includes quite a bit of code from our commercial offerings. This is the most scalable open-source time-series database in the world, giving users the ability to scale their metrics to 1 billion active series and beyond. With the Grafana front end, you can visualize data from many sources, and with Mimir, our mission is to make it your storage layer for any metrics sources.
What’s your favorite outdoor dining restaurant in NYC?
Tajin in the Financial District. They make great Mexican food!


