I am sure many of you have used Google Trends in the past. But, for those of you that are not aware of this terrific tool, now is the time to learn how valuable it can be for your business.
What is Google Trends?
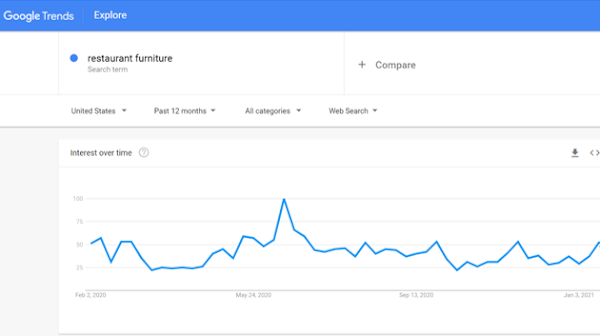
Google Trends is a tool that can tell you how searches for a specific keyword on Google have been trending over time, for whatever date range you are most interested. As an example, here is the search traffic trend for the term “restaurant furniture” for the last year:
As an investor in Restaurant Furniture Plus, this data is very important to me, as a tool to know whether the industry is moving up or down, and how the industry is behaving year over year, which I then can compare to our own revenue results. It also tells me whether or not we are gaining or losing market share, compared to our competitors, which I will detail below. The way to read this chart is the highest point in the period is scored a 100, and then every other period is indexed against that peak. So, a week showing a score of 25, would have 75% less traffic than the peak week.
What do we see is in this chart–there was a slump starting in March 2020, which is no surprise with the beginning of the COVID pandemic in the U.S. Then, there was an unexpected spike in June 2020, which caught us in surprise. Why was there a spike in the middle of a pandemic when most restaurants were closed? In response to COVID, restaurants were racing to buy outdoor furniture to open patios that were allowed to operate. And, then, the rest of the year, pretty much followed normal seasonal trends–this industry normally peaks in March-June, and then November-December are typically the slowest months of the year. If you looked at this same chart in 2019, you would not have seen a dip in March, you would have seen steady acceleration in demand leading up to new summer restaurant openings and their need for furniture.
How to Use This Data For Your Business–A Couple Case Studies
As discussed, the above can show how the industry is trending, for you to compare your own revenue results. But, if you dive a little bit deeper, it can tell you if you should be happy or sad with your own revenue results. Let’s talk through an example, using the above chart. The month of April had an average score of 27 and the month of May had an average score of 48. That was a 78% increase as the restaurant industry started to shake off the immediate paralysis coming out of COVID.
As I compare that to our Restaurant Furniture Plus data, our revenues in May were up 128% over April. So, yes when I looked at our revenue data in isolation, without Google Trends data, I was obviously happy with the 128% growth. But, when I layered in the fact the industry growth was only 78%, that means that Restaurant Furniture Plus was actually growing 29% faster than the industry was growing. In other words, we were increasing our market share, taking volume away from our competitors, which obviously made us ecstatic. It turned out that in a world post COVID, the internet dealers like us, were taking share away from the offline brick-and-mortar dealers, many of which were closed during this period.
This data is especially helpful in the following scenario. I had a client that was really pleased with their 10% month-over-month revenue growth. And, he thought everything was fine with his business until we layered on the 20% industry growth from the Google Trends data! It was a very sobering moment for my client, as his mood changed from “great, we are growing”, to “oh crap, we are losing material market share” in the snap of a finger.
Some Additional Guidance
Remember, Google Trends is simply traffic data from Google. Your website traffic growth, may or may not be in sync with Google trends. Maybe you have a bottleneck there, with poor search engine optimization, and you are not getting your fair share of the overall internet searches (so, fix that!). And, the above example assumes you have an immediate conversion of website traffic into sales in the same month. That may be the case for low ticket consumer products. But, that is most likely not the case for more expensive B2B products or services, that have a longer sales cycle, especially if they are converted offline. So, instead of mapping Google Trends data to sales or transactions, map it to leads. And, if you are going to map to sales, adjust the analysis for your sales cycle (e.g., April traffic growth with a three-month sales cycle will drive July sales growth).
Closing Thoughts
Hopefully, you now have a new tool that can help you with instantaneous market research and trends on your industry. Use this data to help you plan your month-by-month budgets, for any seasonality in your industry, and to compare how your business is trending versus the industry overall. If you are losing market share, you may not realize it now, but you have a pretty big problem on your hands, that you will need to fix asap. Good luck!


