Earlier, we wrote about the importance of revenue projections for early-stage companies using a hypothetical example of an enterprise SaaS company. Since then, we’ve heard from a number of people who read the post and were interested in learning more — many with a desire to understand the ideal time to invest in salespeople.
We want to help you answer that question by analyzing the payback period of a salesperson and emphasizing the KPIs that are integral to driving ROI from your sales team. Once the payback period is understood, the decision of when to invest in your sales team becomes much more straightforward. It’s worth noting that in this analysis, a mathematical and logical approach is taken, thus assuming product/market fit has been established.
Understanding industry benchmarks is important when developing projections. If you’re projections are too aggressive, it can lead investors to believe your projections are unrealistic; if they’re too conservative, they can make your business look weak. As there are numerous assumptions incorporated in this model, you’ll never be able to directly benchmark each one; however, there are ways to compare your projections with publicly listed companies. A simple test is to analyze quarterly sales and marketing spend versus the annualized increase in quarterly revenue. Our research indicates that this number can range from -1.3 to 1.3, with the majority falling between 0.43 and 0.675.
Here, we’ll walk through two scenarios that outline the typical parameters of a salesperson investment. Both scenarios are identical except for a handful of key assumptions. Our hope is that by quantifying the effect of certain assumptions, we can help those making capital budgeting decisions understand the impact of an additional salesperson.
Our characterization of “impact” encompasses three distinct phases in this scenario: negative ROI, break-even, and positive ROI. As these two scenarios don’t cover the plethora of different variants the decision can take, we’ve included below two template files you can download to follow along:
The first file reflects scenario one and the second file reflects scenario two. We recommend having the model open as you read through the scenarios.
Scenario One
In scenario one, let’s assume a salesperson is hired in January 2017. Their annual base salary is $100,000 ($120,000 fully loaded) and they take 10% commission of all revenue generated. Additionally, they incur monthly sales and marketing expenses of $2,500 and general overheads of $1,000. These expenses are straightforward, known, and can easily be tweaked up or down in the provided model.
As mentioned in our earlier post, projecting revenue for early stage companies is challenging. It requires using a number of assumptions that, for the most part, companies are forced to hypothesize until they have sufficient data to confirm their hypotheses. The revenue build used in this model is very similar to that which was outlined in the previous post. There are a number of KPIs incorporated, all of which have varying degrees of influence on revenue; these KPIs will be defined later in the post. In scenario one, KPI assumptions are as follows:
● Salesperson Start Date: January 2017
● Salesperson Ramp-up: 6 months
● Annual Bookings Quota: $1,000,000
● Sales Cycle: 60 days
● Average Contract Size: $20,000
● Months to Contract Start: 4
● Contract Length: 12 months
● Annual Churn: 10%
Outlined above includes the total cost involved in employing a salesperson as well as the total revenue they generate. A salesperson is considered “paid back” once cumulative gross profit from the deals they have closed is greater than cumulative costs. Given that this example involves a SaaS company, I have assumed cost of goods sold (COGS) are 20% of revenue (80% gross margin).
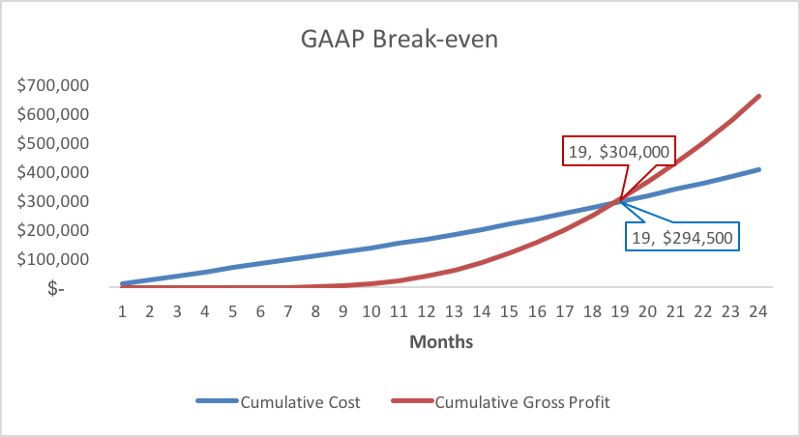
Item 1 — Scenario One Generally Accepted Accounting Principles (GAAP) Break-even
Item 2 — Scenario One GAAP Salesperson Profitability
Item 1 shows how long it takes for cumulative gross profit to intersect cumulative costs. Under these assumptions, the payback period is 19 months.
Item 2 shows the three phases of a salesperson investment. Negative ROI is defined as the period in which monthly expenses are greater than monthly gross profit. This period runs from month one to month 11. The break-even period runs from months 12 to 19. This represents the point the salesperson moves from monthly break-even to cumulative break-even. Finally, the positive ROI period runs from month 19 onward.
Another important consideration for early stage companies is the point of cash flow break-even. The following assumptions govern this analysis:
● Customer Billing Cadence: Monthly
● Accounts Receivable:
— Cash Collections: 45 Days
● Accounts Payable:
— Immediate: 0 Days
— Credit Card: 30 Days
— Payment Terms: 45 Days
These assumptions outline the working capital implications of a salesperson investment. A monthly customer billing cadence means customers are billed each month; however, the cash collection assumption of 45 days stipulates that it takes the business, on average, 45 days to collect accounts receivable from its customers. Importantly, items such as salary, employee benefits and taxes, and overhead (rent, etc.), are classified as immediate, which means they are paid in the month in which they are incurred. Sales and marketing expenses follow the credit card payment cadence, in which it’s assumed that expenses are paid out 30 days after incurred.
Finally, commission is paid out following the payment terms cadence. You will notice this is set to 45 days, which is the same as the cash collections assumptions. Aligning these assumptions is analogous to saying that commissions are paid out when the business receives cash.
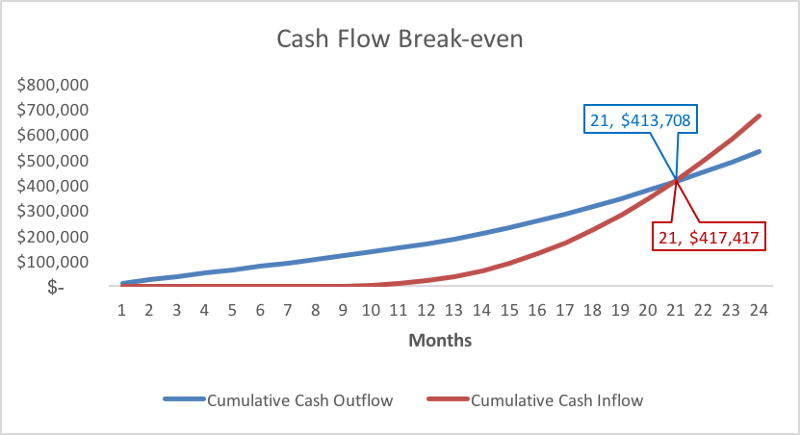
Item 3 — Scenario One Cash Flow Break-even
Item 3 shows cash flow break-even occurring after 21 months.
Scenario Two
Under scenario two, more favorable assumptions will be applied to demonstrate the effect of optimizing certain key assumptions. Changes relating to assumptions driving the revenue build include:
● Salesperson ramp-up: 4 months
● Annual Bookings Quota: $1,200,000
● Months to Contract Start: 1
Changes relating to assumptions driving working capital include:
● Customer Billing Cadence: Upfront
● Cash Collections: 30 Days
Customer billing cadence upfront means that customers are billed upfront for the entire annual contract. Operating cost assumptions as well as the assumption for COGS will be left unchanged.
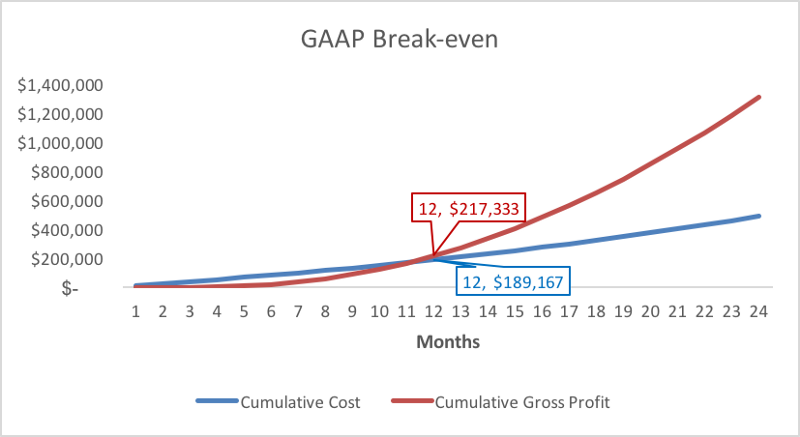
Item 4 — Scenario Two GAAP Break-even
Item 5 — Scenario Two GAAP Salesperson Profitability
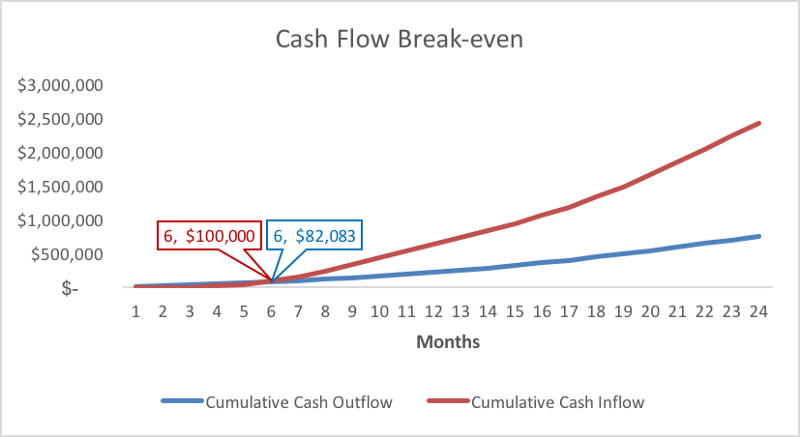
Item 6 — Scenario Two Cash Flow Break-even
Item 4 shows that GAAP break-even occurs after 12 months. Item 5 shows the negative ROI period lasting six months, break-even lasting five months, and positive ROI occurring after 12 months. Item 6 shows cash flow break-even after six months.
Scenario Comparison
The difference in both GAAP and cash flow payback periods between these two scenarios is prodigious. Admittedly, these scenarios are probably at each end of the spectrum and most SaaS companies will fall somewhere in between them, so we’ll touch on the consequences of each KPI changed. Starting with salesperson ramp-up, we’ll discuss all the changes that reduce GAAP break-even from 19 months to 12 months and cash flow break-even from 21 months to six months.
The salesperson ramp-updecreased from six months to four months. A safe and commonly used assumption for the time it takes to integrate a new salesperson into your company and for them to be contributing at 100% effectiveness is roughly six months. If your organization can get creative and find a way to decrease that ramp-up, you will decrease the negative ROI and break-even periods and maximize the positive ROI period. This change reduced GAAP break-even from 19 months to 17 months and cash flow break-even from 21 months to 19 months.
The annual bookings quota increased from $1,000,000 to $1,200,000. It goes without saying that increasing a salesperson’s quota while maintaining quota attainment is a great way to increase revenue; however, it can be tough to actually implement. Structuring commissions so as to incentivize the desired result could be the answer. This change reduced GAAP break-even from 17 months to 16 months and cash flow break-even from 19 months to 18 months.
The months to contract start decreased from four months to one month. When closing a new customer, there is inevitably a lag between when the contract is signed and when the customer starts paying full MRR. This can be due to technical integration periods, unpaid pilots, or simply a lack of urgency in commencing the contract. This time represents a period where you’re still paying costs to your salespeople but the clients they closed are not generating revenue. This change reduced GAAP break-even from 16 months to 12 months and cash flow break-even from 18 months to 14 months.
The customer billing cadencechanged from monthly to upfront. For an early stage company, getting customers to pre-pay an annual contract can be invaluable. It dramatically improves working capital, supplements the need to raise capital (preserving your precious equity), and allows you to grow at a faster pace. This change doesn’t affect GAAP break-even, it only affects cash flow break-even. However, once you have analyzed the cash flow consequences, you should be able to quantify the benefit that upfront payment brings and therefore offer a discount that is commensurate with the benefit. This change reduced cash flow break-even from 14 months to seven months.
Finally, cash collections decreased from 45 days to 30 days. As with the customer payment cadence changes, this change only affects cash flow break-even. The faster you collect cash from your customers, the better your working capital will be. Again, using this model you can quantify the benefit of improved customer collections and offer a discount for fast payment commensurate with the benefit. This change reduced cash flow break-even from seven months to six months.
Hopefully, all of this helps outline the many different factors that define how successful a sales function can be in an early-stage organization. As part of our role in the Due Diligence team at ff Venture Capital, we commonly get pitched by startups boasting lofty revenue projections driven by heavy investment in sales “after they raise capital.” They apply the simplistic equation of increase salespeople = increase revenue. We’ve attempted to show here that approaching the decision using this equation could have dramatic consequences if the right KPIs are not optimized.
Understanding the factors that drive positive ROI will give investors faith that you can execute on your business plan. Although your vision is what will excite investors about your company, the decision to invest will ultimately be driven by their confidence in your ability to execute.
This article was co-authored by Paul Bianco, a Director at ff Venture Capital. In this role, Paul is member of the Acceleration & Diligence Teams. As a member of ffVC’s Acceleration Team, Paul works alongside portfolio companies, assisting them with developing financial models, budgeting, planning, financial analysis, and other financial matters. Paul also leads the financial piece of ffVC’s Due Diligence process.


