I’ve written 18 crypto related posts since I saw the crypto light on June 29th. I could have titled most of those posts “what I learned about crypto this week”. After three months, on October 8th, I published my first thought piece “7 Thoughts On Blockchain, Cryptocurrency & Decentralization After Three Months Down The Rabbit Hole”. It’s, by a margin, the most read/clapped for post I’ve written. The 5th thought was “ It’s A Bubble….So What”. I went on to explain:
I say “so what” because I believe in Amara’s Law: We tend to overestimate the effect of a technology in the short run and underestimate the effect in the long run. This is part of the reason we get bubbles. We get overexcited about a new technology and we drive up prices beyond any reasonable valuation. Bubbles can go on for years. The internet bubble lasted 5+ years.
With that thought piece at its 3 week anniversary, my thinking has evolved. It feels like we’re having a Cambrian Explosion in crypto. Just as the Cambrian period enabled the creation of a multitude of new life forms, the emergence of blockchain, cryptocurrency, and decentralization, is opening up a wide range of previously unavailable markets, as well as new ways to compete against entrenched incumbents. Sure, most of the new crypto entities coming in to being today will die out, but many of the ones that survive will be epic.
Given that view, I think the three charts below give additional perspective to the crypto bubble debate.
1. Amazon Price Chart 1997–1999
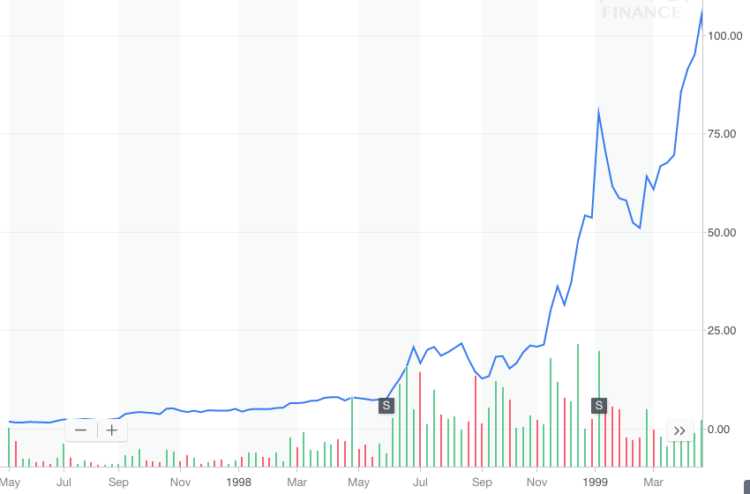
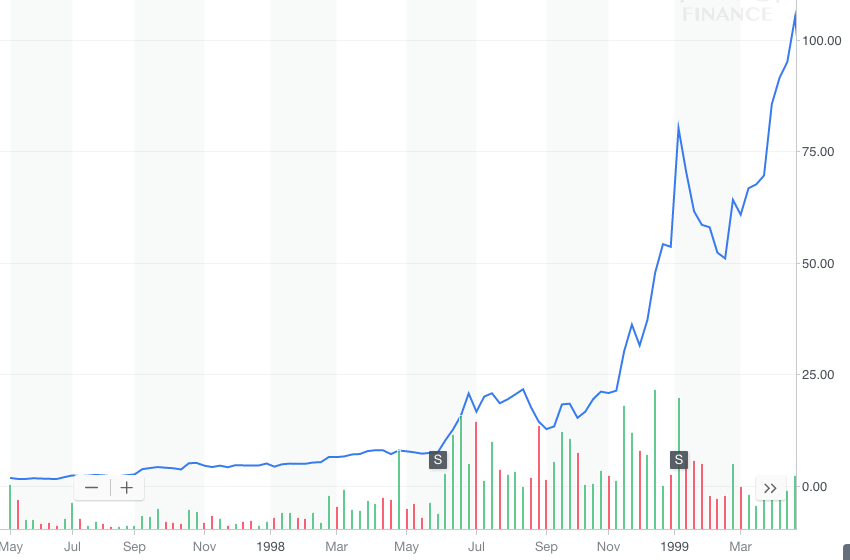
The chart below looks at the meteoric rise of Amazon’s price from it’s IPO in May, 1997 (at a split adjusted $1.50 a share) to a peak of $105+ in April, 1999. Amazon’s share price went violently up 70X+ in under two years. Was that a bubble?
2. Amazon Price Chart 1997–2001
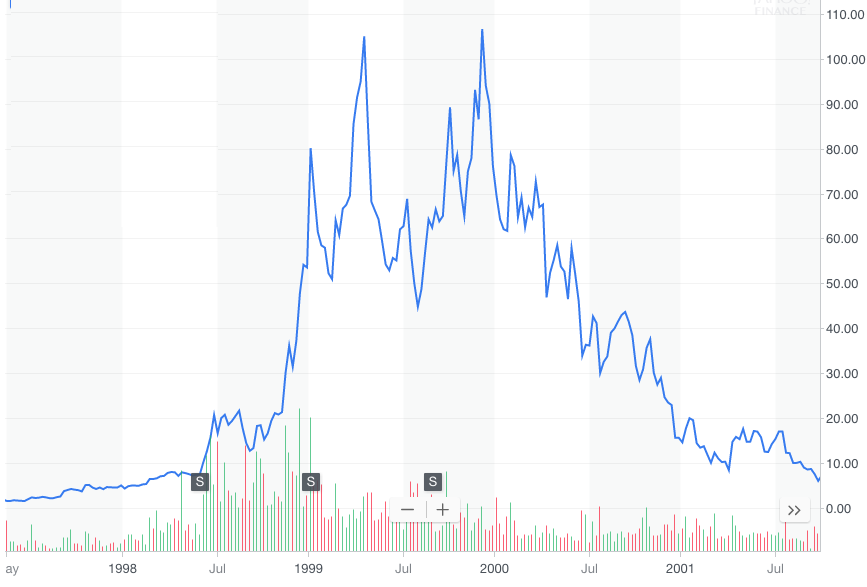
The chart below looks at the implosion of Amazon’s stock price from it’s actual peak in December, 1999, at $106+, to its low of less than $6 in September, 2001. That’s a drop of 95%. Is that a bubble bursting?
3. Amazon Share Price 1997–2017
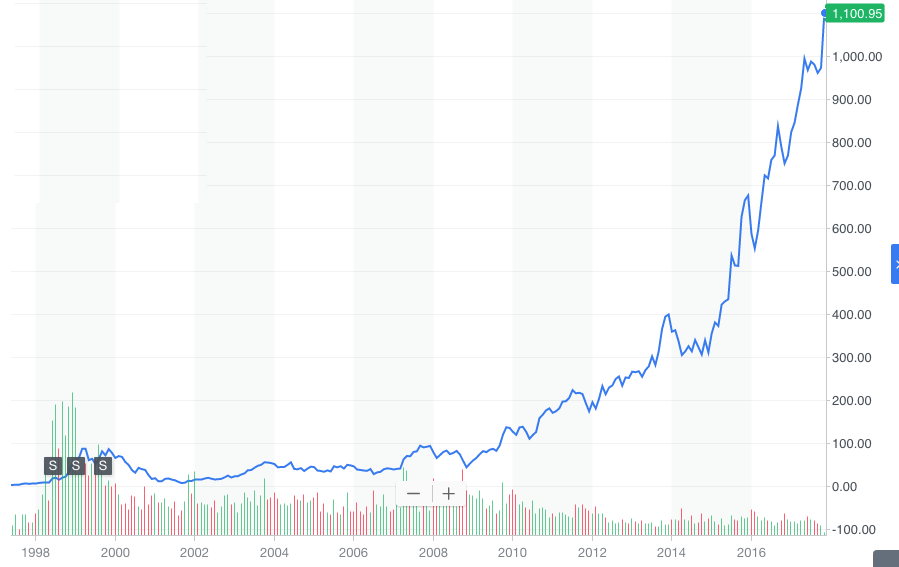
Since Amazon’s share bottomed out in September 2001, it is up more than 180X to Friday’s close of $1,100. From its IPO price of $1.50, it’s up 275X, generating a compounded annual return of 39%.
With the perspective of more time, when we look at Amazon’s price chart from 1997–2017, that violent up ‘97-’99 (bubble?), and violent implosion down ‘99-’01 (a bubble crashing?), we see it really wasn’t either of those.
It turns out Amazon’s share price from 1997–2001, when put in to the context of what Amazon became, was just a ……. blip.
In 20 years, when crypto has disrupted as many industries as the internet has, we’ll look back at the previous violent crypto price swings, and the violent crypto price swings certain to come, and they’ll simply be blips in crypto’s long term rise. They’ll be blips in crypto’s massive value creation. And most importantly, they’ll be blips on the path to the better (decentralized) planet we’ll be living on.


