I read two terrific articles this month that summarized venture capital trends over the last several years. The first was Pitchbook’s 2016 VC Valuations Report and the second was CB Insights’s Venture Capital Funnel. They are a must read for anyone thinking about going down the venture capital route, in terms of financing their growth. Read together, they help you better understand what you can expect along the way. Below is my summary of these two articles that are most relevant to you.
Starting with the CB Insights data, they looked at 1,098 companies that raised seed stage capital between 2008 and 2010, and then tracked the outcome of those companies over the following years. Approximately 46% raised a following Series A, 28% a Series B, 14% a Series C, 6% a Series D and 2% a Series E round. And, of this group, only 28% of them got to an M&A exit for their investors. And, of those exits, 71% where under $50MM, 10% were $50-$100MM, 8% were $100-$200MM, 6% were $200-$500MM, 3% were $500MM-$1BN and only 2% were over $1BN.
So, what’s the conclusion from this data. Entrepreneurs think they have the best idea in the world and they are on their way to building the next unicorn level company. But, only 1% do. So, know going into the process, that there is a big drop off from one step of your growth to the next, with a lot of headwind along the way. The odds to getting to a huge payday is very low. And, the odds to getting to any exit are not great, with only 3 in 10 getting to that point. So, most of you are going to end up either with self sustaining businesses that can’t be sold, or more likely, out of business. A pretty depressing concept before you even get started!!
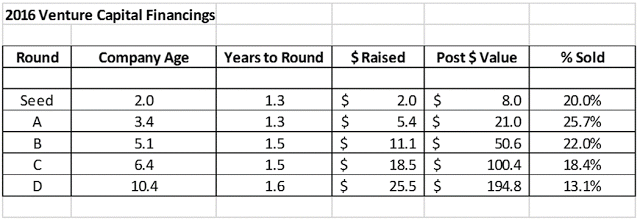
Now moving on to the Pitchbook data, I put this chart together to help me better look at it:
There were so many nuggets to learn from this chart. First of all, you are going to have 1-2 years of history before you raise penny number one from professional investors. So, be prepared to bootstrap finance your business until you get to your proof-of-concept point the investors are looking for. Second, look how fast the process moves, which says two things: (i) buckle your seat belt, it is going to be a helluva ride; and (ii) you are never going to get out of fund raising mode, which sucks if you prefer to be focusing on the business. Third, you get some good data here on how much you should raise and how much you should value your company for, at each stage of its development. And, lastly, when you add up all the dilution from the multiple rounds, the founder’s stake is going to dilute itself down from 100% day one to 33% after the Series D. And, if there are multiple founders that gets split between you. So, you will be doing a ton of work that the investors are going to see 67% of the benefit.
There were some other interesting data points in the Pitchbook article: (1) valuations are pretty lofty right now, steadily rising in each round level since 2010 (up about 2x over the last several years)–that can’t last for much longer; (2) flat or down rounds make up a healthy 26% of the market, so even if you are raising new funds, valuations don’t always go up; and (3) if you have a strategic corporate investor as part of your investor group, the VC’s like that, as evidenced by them paying a 54%-65% premium valuation for companies with a corporate backer vs. companies without one (so figure out how to get a corporate investor to take a liking to your business, if you can).
So, there you have it–everything you need to know to in terms of raising venture capital for your business over time, and what to expect along the way. What do you think? Still interested in taking the leap, after studying this data??


