Just as large numbers of people believe that Donald Trump should release his taxes so the world can get a better picture of his financial situation, I believe that Snap should release historical engagement metrics, so investors can get a better picture of Snap’s situation, as a business. I assume Trump would release his taxes if they revealed a positive narrative about his financial situation. I similarly believe Snap would reveal its historical engagement metrics if it were beneficial to its IPO. Below is some context for this view.
The Facebook Lesson
In March of 2010 I wrote a research report on Facebook valuing the company at $50 billion. Facebook was trading in the private markets at a $16 billion valuation at the time. The report garnered a good deal of press (most of it derisive).
My valuation was based on a simplistic six year financial model. The company wouldn’t talk to me. But there was enough publicly available information that I was able to estimate Facebook’s revenue and model it out for the next six years.
As it turned out, my 2014 revenue estimate for Facebook, estimated by me in 2010, was $12.33 billion, which ended up underestimating Facebook’s actual 2014 revenue (of $12.45 billion) by just 1%. How did that I got that close? Well luck was involved. But the simple math I use for projecting the revenue of any traditional or digital media company is:
ENGAGEMENT = REVENUE
It’s really not more complicated then that. Given the trajectory of Facebook’s engagement in 2010, I estimated that Facebook would have 11.8% of all time spent on the internet in 2014, and that would translate in to 11.8% of all internet advertising dollars.
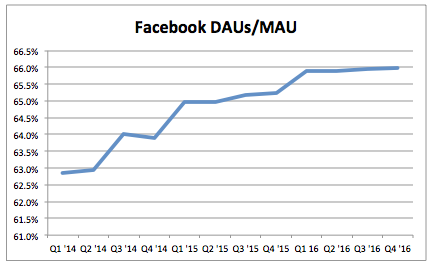
Facebook. is now worth $377 billion dollars for the simple reason that they continue to grow engagement. In Facebook’s case, I use their publicly reported numbers, DAU/MAU (Daily Active Users/Monthly Active Users), as the best publicly available proxy for Facebook’s engagement. That engagement number, remarkably, continues to grow after all these years!
The Twitter Lesson
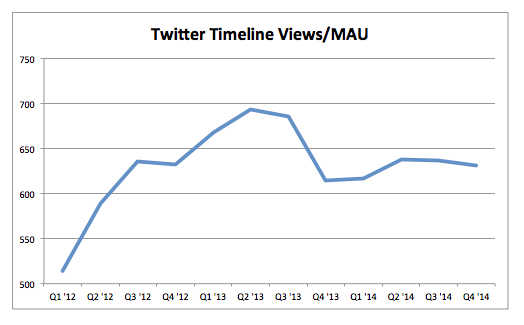
When the engagement trajectory is going the other way, it’s difficult, to impossible, to turn around. Just ask Twitter. When Twitter IPO’d in November of 2013, they released Monthly Active Users metrics, and Time Line View metrics. So I divided the two (Timeline Views/Monthly Active User) as the best publicly available proxy for engagement. At the time of it’s IPO, that engagement metric had already peaked, and would continue to largely decline, until Twitter stopped reporting the Time Line View numbers in Q4 ’14.
When companies do not report a number, or stop reporting a number, it is generally because the number does not reflect well on the company.
The Snap Problem
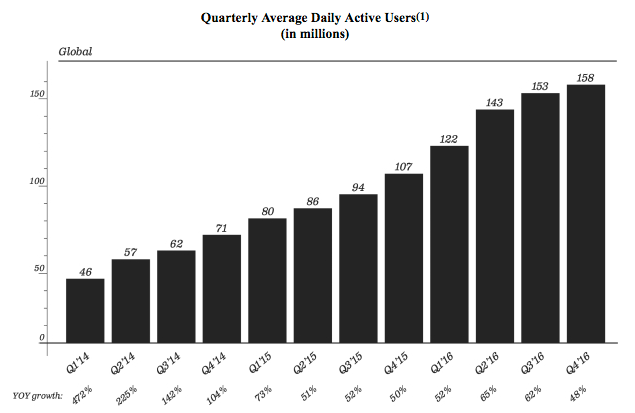
Which brings us to Snap, which released it’s S-1 on February 2nd. In the filing, Snap gives DAU’s over time.

In it’s S-1 Snap states that “We assess the health of our business by measuring Daily Active Users because we believe that this metric is the most reliable way to understand engagement on our platform”. I have to say, that statement is nonsensical. DAUs is exactly what it is. USERS. It is NOT really engagement.
SNAP does give some engagement metrics in its S-1, which stated “… over 2.5 billion Snaps are created every day. On average, our users visit Snapchat more than 18 times per day, and spend 25 to 30 minutes on Snapchat every day.” But those are snapshots of engagement (no pun intended), and do not give any sense of the the trajectory of Snap’s engagement. Are the engagement metrics going up over time, which would foretell a bright future for Snap, or are the engagement metrics decreasing, which would likely be problematic (e.g. see Twitter).
As I stated before, when companies do not release data, like Snap’s engagement metrics going back over time, it is generally because those metrics do not reflect well on the company.
It’s important to note, that revenue growth is a lagging indicator of engagement growth. For example, Twitter’s advertising revenue was still growing dramatically when it went public, even though it’s engagement was already flagging. That’s why Twitter’s stock price was still double it’s IPO price a year and a half after it’s IPO. But ENGAGEMENT = REVENUE (eventually). And eventually, Twitter’s stock cratered.
Now there are other data sources to use to get proxies for Snap’s engagement. My favorite mobile data source is SimilarWeb.
The Scariest Thing About SNAP
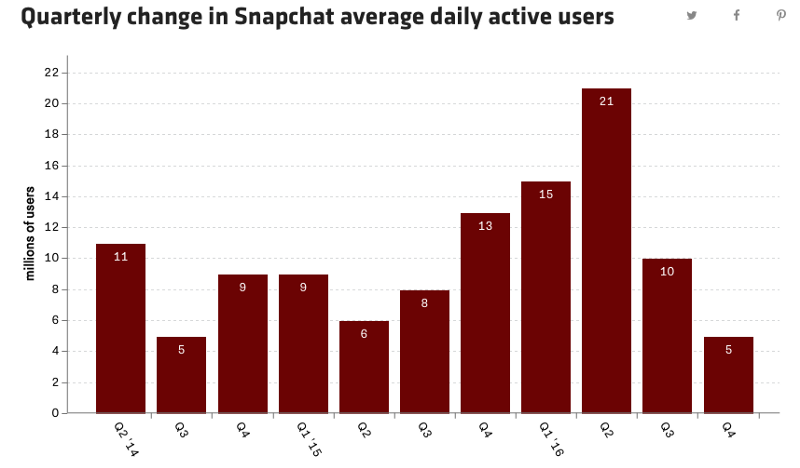
recode recently wrote a post titled “The one chart that should scare Snapchat investors”, which referred to this chart based on data released in SNAP’s S-1:
While I agree that the chart above is indeed scary if you’re a Snap investor. However, to me, the far scarier thing about the Snap’s S-1 was what wasn’t in the S-1, namely, the engagement metrics over time. When companies do not report the most important metrics, there is generally a reason.
In any case, I believe Snap should amend its S-1 and provide the historic engagement metrics. It would enable investors to better understand the most important aspect of the Snap business. But if Snap doesn’t…. investors beware.


