In following yesterday’s piece on the 13 Unicorns in NYC, today I take a deeper dive into the composition of these startups as well as some trends in the NYC unicorn universe. We break down our data to a few key segments that include funding, industry, capital efficiency, valuation, and team.
This list was compiled from data retrieved on 1/20/16 from our friends at CrunchBase and does not include companies that underwent liquidity events (acquisitions or IPOs). Educational data was extrapolated from publicly available sources including LinkedIn and Wikipedia.To keep the focus on traditional tech-enabled startups, real estate companies were excluded from this analysis
CLICK HERE TO SEE EVERYTHING YOU EVER WANTED TO KNOW ABOUT BUILDING A NYC UNICORN
Summary of the Analysis
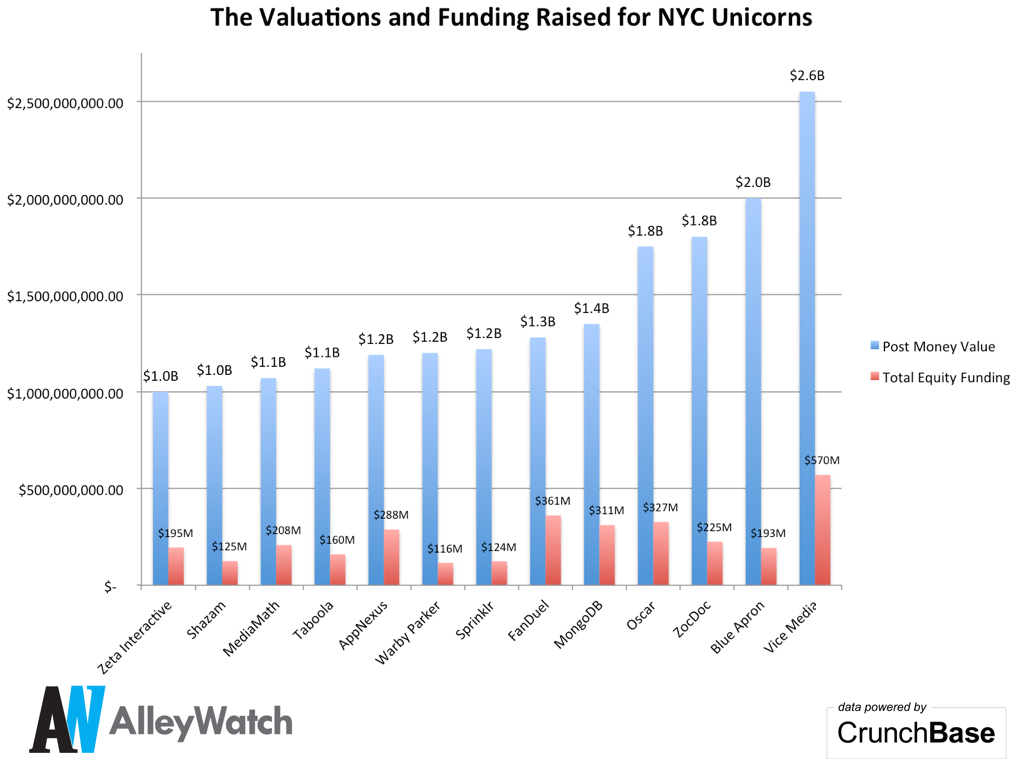
There are 13 active unicorns in NYC that have post-money valuations exceeding $1B as of the last raise TWEET THIS
The total post money valuation of these companies was $18.6B TWEET THIS
The oldest unicorn in this set was founded in 2002
The median post money valuation of these companies was $1.22B TWEET THIS
The average post money valuation of these companies was $1.4B TWEET THIS
The unicorns in NYC have raised a total of $3.2B in equity funding TWEET THIS
The unicorns in NYC have raised an average of $246.4M each TWEET THIS
46% of unicorns in NYC were started in 2007 TWEET THIS
The average age of a NYC unicorn is 8 years TWEET THIS
Industry
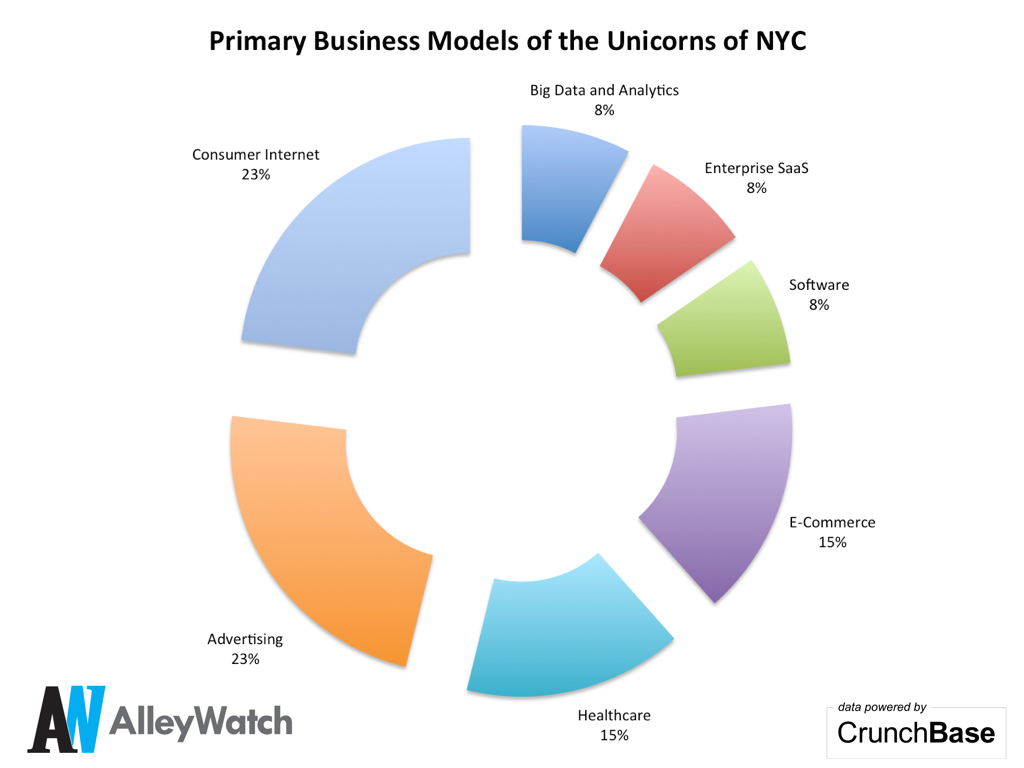
Consumer internet and adtech companies comprised the largest number of unicorns in NYC; followed by healthcare and ecommerce.
23% of the unicorns in NYC are focused on consumer internet TWEET THIS
23% of the unicorns in NYC are focused on adtech TWEET THIS
15% of the unicorns in NYC are focused on healthcare TWEET THIS
15% of the unicorns in NYC are focused on ecommerce TWEET THIS
Capital Efficiency
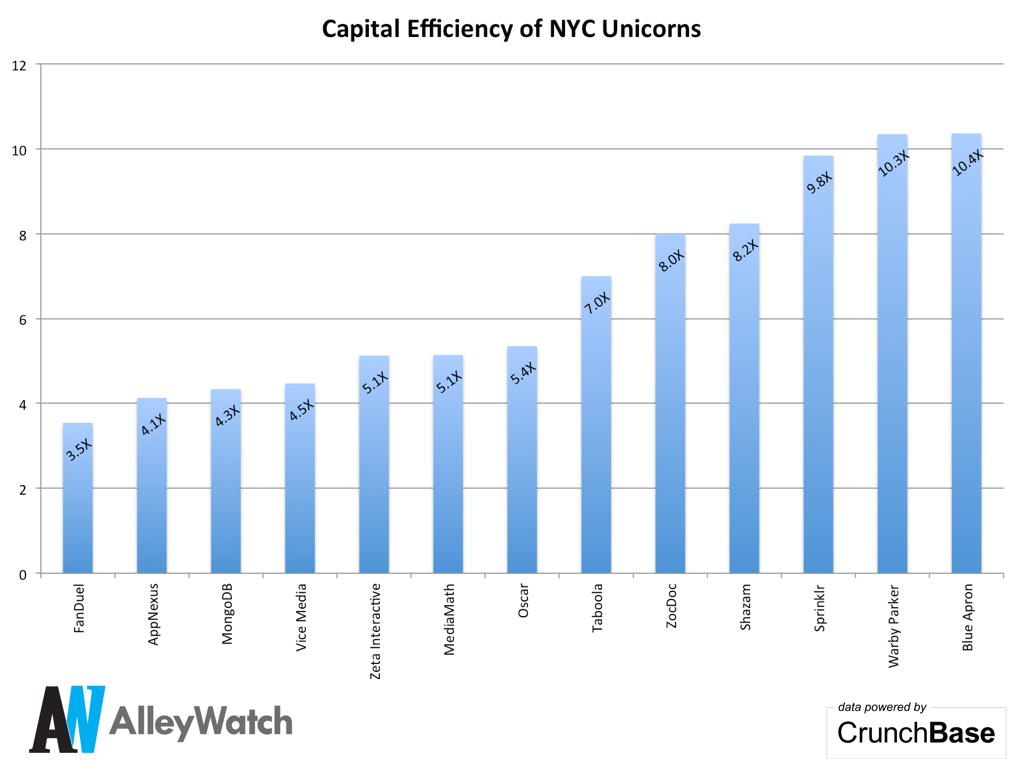
Ecommerce companies are the most capital efficient startups in our set and adtech companies were the least efficient. The average capital efficiency in this set was 6.18x. Capital efficiency is measured by total post money valuation divided by the total equity funding raised.
Ecommerce unicorns deliver the highest multiple (10.35x average) of valuation over capital raised. TWEET THIS
Adtech companies deliver the lowest multiple (5.42x) of valuation over capital raised in instances where there were multiple unicorns in an industry classification. TWEET THIS
Blue Apron was the most capital efficient unicorn on the list (10.36x) TWEET THIS
FanDuel was the least capital efficient unicorn on the list (3.55x)
Valuation
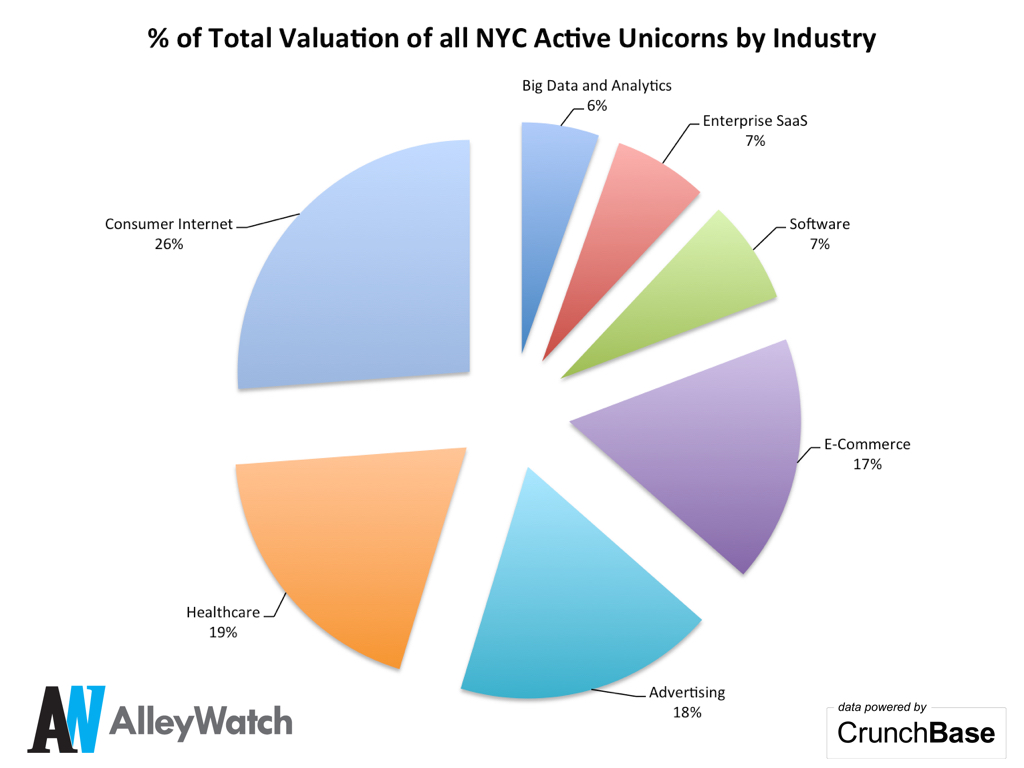
The total post money valuation of these companies was $18.6B. Of that aggregate amount, consumer internet drives the most value; followed by healthcare, advertising, and then ecommerce.
26% of the valuation of the unicorns in NYC is derived from consumer internet startups TWEET THIS
19% of the total valuation of the unicorns in NYC is derived from healthcare startups TWEET THIS
18% of the total valuation of the unicorns in NYC is derived from adtech startups TWEET THIS
17% of the total valuation of the unicorns in NYC is derived from ecommerce startups TWEET THIS
Team
Education and the quality of that education played an important role in the development of our data set with a majority of founding teams having an Ivy League educated founder and an MBA on the founding team. Gender diversity remains an issue.
Only 1 unicorn in NYC was founded with a solo founder. TWEET THIS
54% of unicorns in NYC have at least one Ivy League educated founder on the team. TWEET THIS
69% of unicorns in NYC have at least one MBA on the founding team. TWEET THIS
Only 1 unicorn in NYC has a woman on the founding team. TWEET THIS
Only 1 unicorn in NYC has a founder who dropped out of college. TWEET THIS
Image credit: CC by Dawn (Willis) Manser


