This week, we take a look at the state of venture capital and early stage funding in NYC and nationally over the last 12 quarters from the 2nd quarter of 2012 through the first quarter of 2015. Analyzing some publicly available data from our friends at CrunchBase, we break down national and NYC aggregate statistics for deals by stage of funding (Angel/Seed, Series A, Series B, and Series C+). To further the analysis, we have included some data that demonstrates historical trends in terms of average round sizes as well as New York’s relative share of the total funding market over time.
CLICK HERE TO SEE ALL THE NUMBERS BROKEN DOWN AND SOME PRETTY CHARTS
Key Takeways:
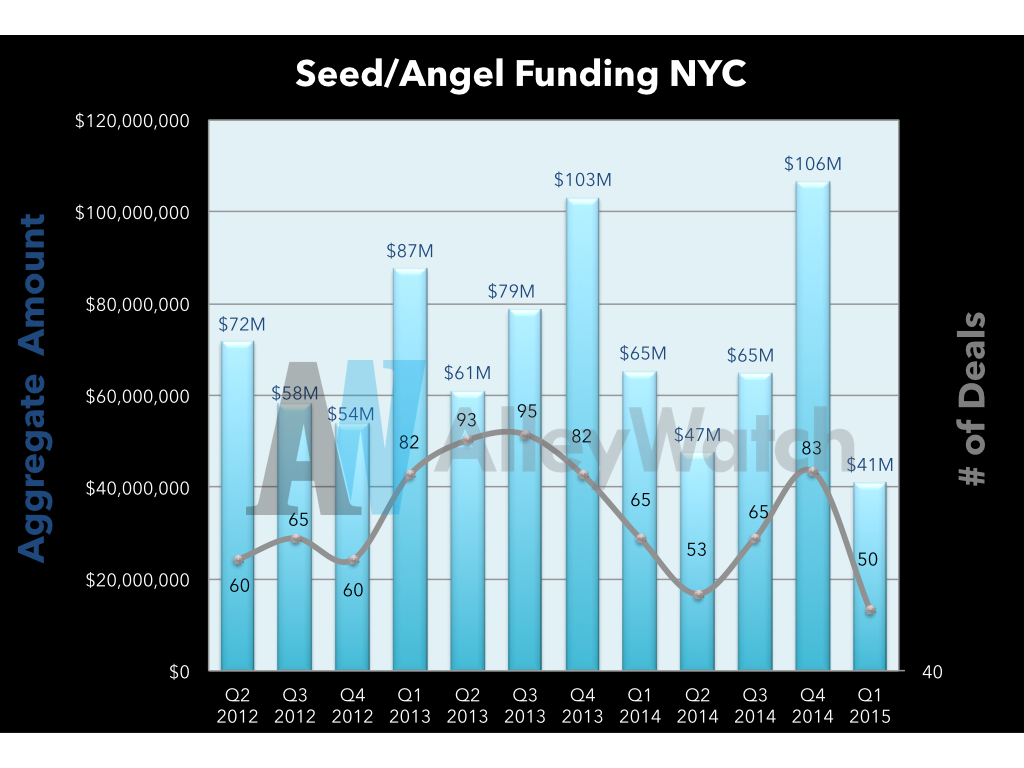
After a monstrous 4th quarter, seed and angel investment took a back seat as both the amount invested as well as number of deals fell to 3 year lows.
Tweetables:
$41M was invested in seed/angel rounds in Q1 of 2015 in NYC in 50 deals Tweet this
$879M was invested in 860 seed/angel rounds in NYC over the last 12 quarters Tweet this
Key Takeways:
The national market was not much different from New York as the number of early stage financings hit a 3 year low for Q1 and the amount invested represents nothing too significant. Historically, the first quarter has been relatively strong.
Tweetables:
$392M was invested in 368 seed/angel rounds in Q1 of 2015 in the US Tweet this
$5.5B was invested in 6670 seed/angel rounds in the US over the last 12 quarters Tweet this
Key Takeways:
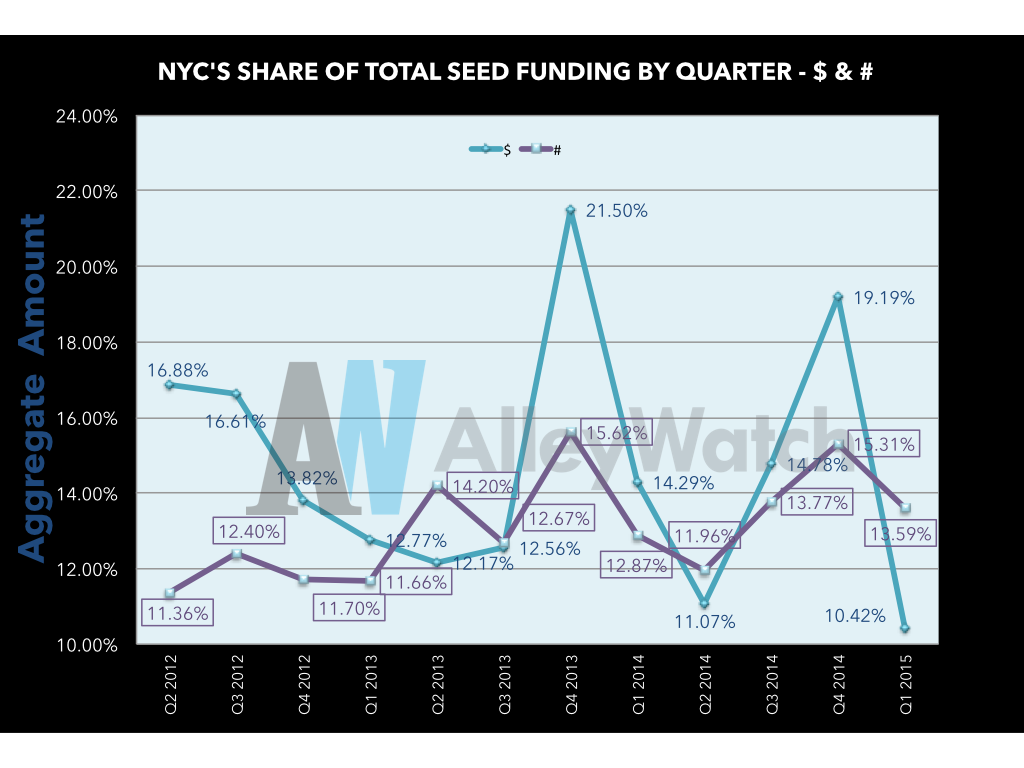
New York’s share of total startup early stage financing has steadily increased in the percentage of deals but has remained relatively unpredictable in terms of dollar amounts with a few large financings here and there skewing some of the previous 12 quarters.
Tweetables:
Q1 NYC seed/angel rounds comprised 13.6% of total in the US in terms of $ Tweet this
Key Takeways:
The amount invested in NYC Series A deals has increased steadily over the last 12 quarters while the number of deals have not increased as quickly, which will leading to larger round sizes as we’ll see later.
Tweetables:
$196M was invested in 23 Series A rounds in Q1 of 2015 in NYC Tweet this
$1.78B was invested in 248 Series A rounds in NYC over the last 12 quarters Tweet this
Key Takeways:
Similar to NYC, the national Series A funding has increased overall over the last 12 quarters but not at the same pace as New York while the number of deals have remained relatively stable.
Tweetables:
$1.37B was invested in 185 Series A rounds in Q1 of 2015 in the US Tweet this
$14.2B was invested in 2152 Series A rounds in the US over the last 12 quarters Tweet this
Key Takeways:
It is interesting to note that while things have remained steady in terms of growth at the aggregate level, that New York’s share of both the dollar and number of deals have steadily increased over the last 3 years.
Tweetables:
Q1 NYC Series A rounds comprised 14% of total $ amount in the US with 12% of deals Tweet this
Key Takeways:
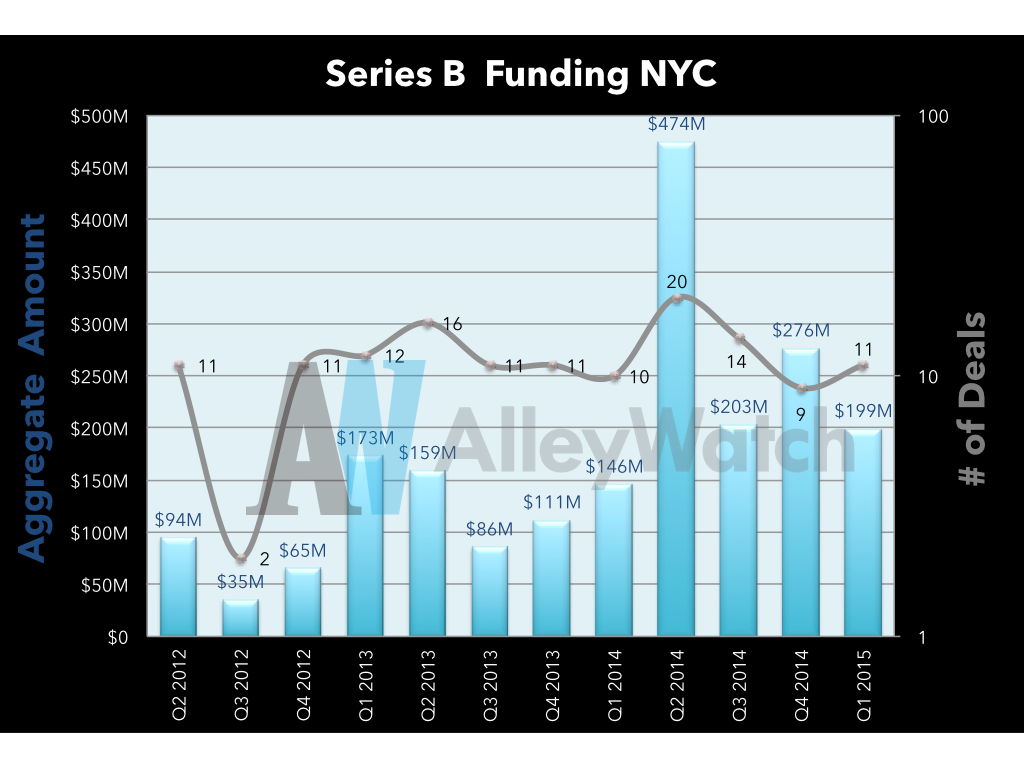
The number of NYC Series B financings have remained relatively stable over the last 3 years in New York and consistently $200M is being invested over the last year each quarter into these financings.
Tweetables:
$199M was invested in 11 Series B rounds in Q1 of 2015 in NYC Tweet this
$1.79B was invested in 127 Series B rounds in NYC over the last 12 quarters Tweet this
Key Takeways:
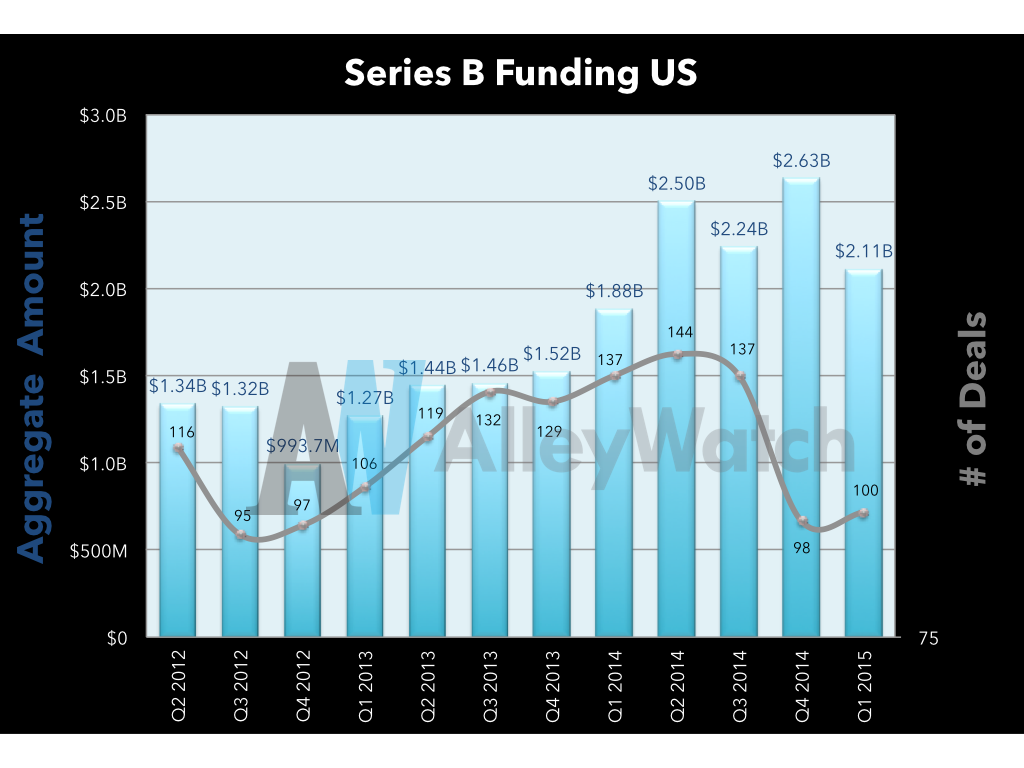
The amount invested each quarter in Series B financings nationally has steadily been increasing but what is important to note that over the last two quarters the number of deals have fallen while the amounts have increased or remained relatively steady. We’ll see the impact in the larger average Series B rounds later in the report.
Tweetables:
$2.11B was invested in 100 Series B rounds in Q1 of 2015 in the US Tweet this
$17.38B was invested in 1172 Series B rounds in the US over the last 12 quarters Tweet this
Key Takeways:
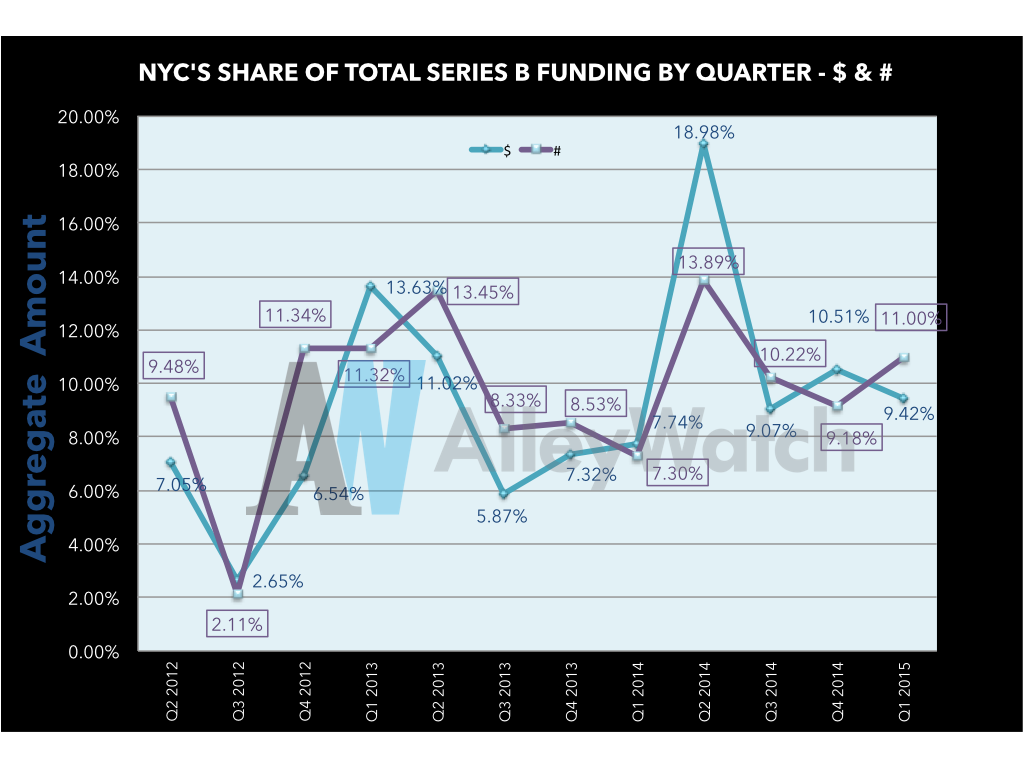
New York is undoubtedly gaining a bigger share of the Series B pie as New York’s claim on both the number of deals and dollar amounts have been steadily increasing over the last 12 quarters.
Tweetables:
Q1 NYC Series B rounds comprised 9% of total $ amount in the US with 11% of deals Tweet this
Key Takeways:
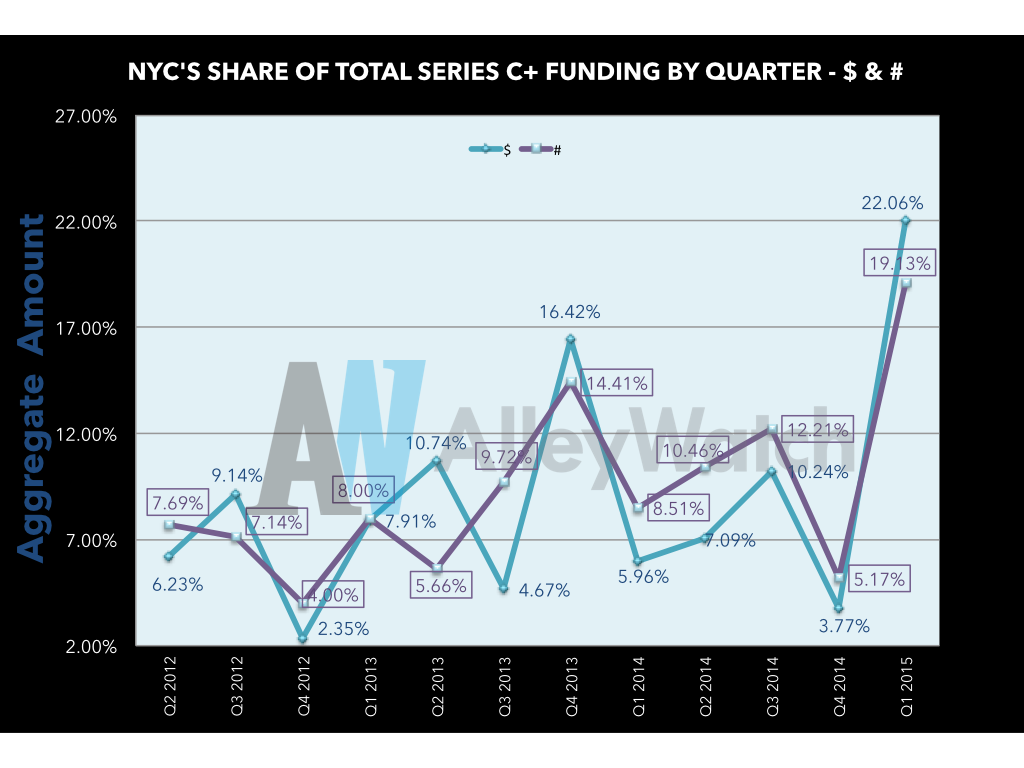
This is where New York shines thus far. In Q1, New York set record levels for later stage financings, nearly doubling the previous high set in Q4 of 2013. The number of deals in Q1 is also quite impressive. With all of these late stage financings, more and more liquidity is on the horizon. Get the exit caps ready!
Tweetables:
$943M was invested in 22 Series C+ rounds in Q1 of 2015 in NYC, an all time high Tweet this
$4.2B was invested in 133 Series C+ rounds in NYC over the last 12 quarters Tweet this
Key Takeways:
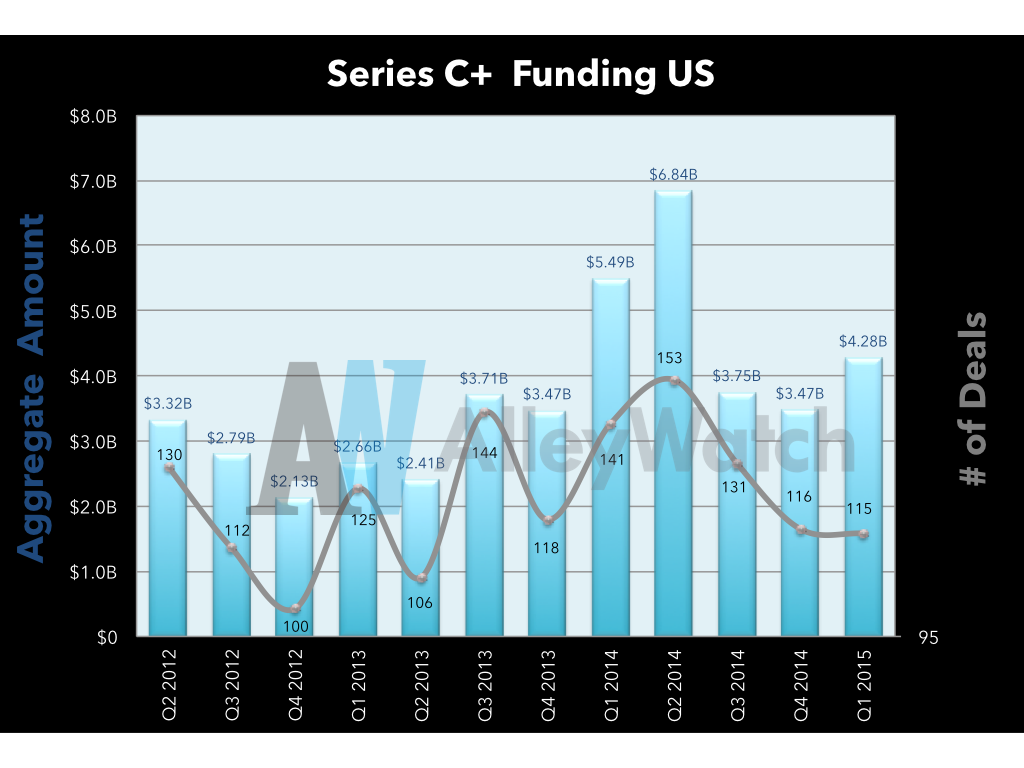
Later stage fundings have remained relatively steady in Q1 nationally and did not enjoy the same level of activity which was found in NYC during the same time period. Also there has not been a significant change in the number of financings and dollars invested in the later stages across time although there is a slight bias towards the upside historically.
Tweetables:
$4.28B was invested in 115 Series C+ rounds in Q1 of 2015 in the US Tweet this
$37.22B was invested in 1275 Series C+ rounds in the US over the last 12 quarters Tweet this
Key Takeways:
New York City absolutely crushed it during Q1 where there was a massive spike in not only the number of late stage deals funded but also the dollar amounts of these deals.
Tweetables:
Q1 NYC funding rounds comprised 22% of total $ amount in the US with 19% of deals Tweet this
Key Takeways:
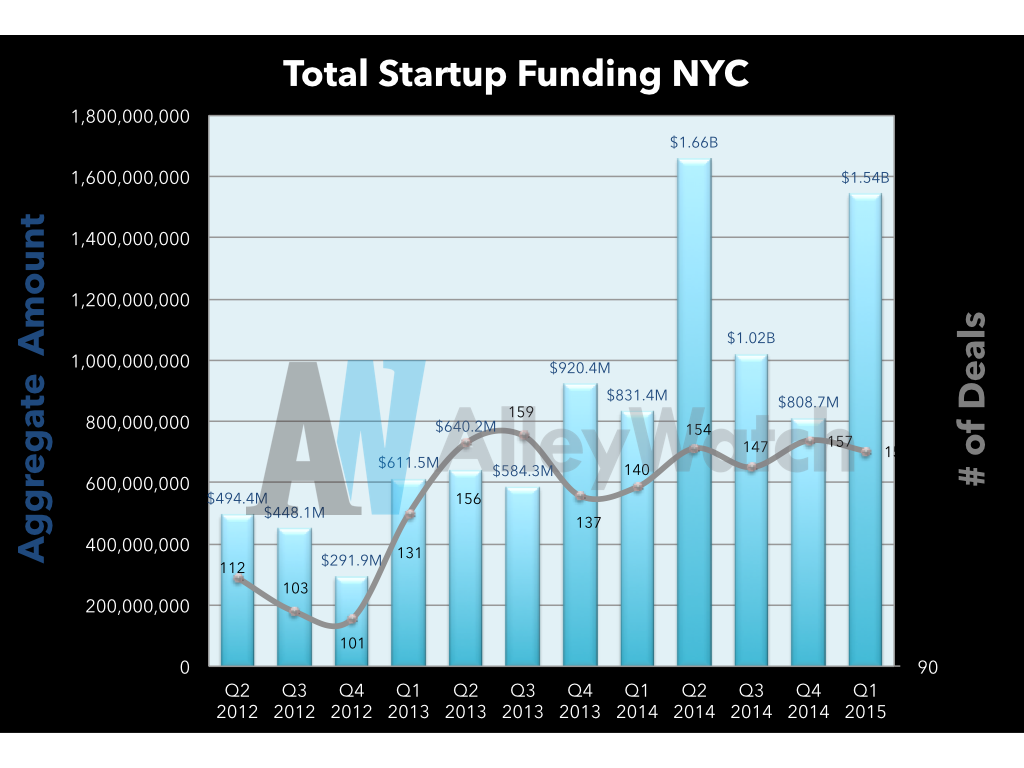
Thanks to the increase in late stage rounds, NYC recorded it second highest quarterly total in history, raising over $1.5B. Over the last year, on average ~$1B is being invested into startups in the city each quarter.
Tweetables:
$1.54B was invested in 153 startup rounds in Q1 of 2015 in NYC, 2nd highest ever Tweet this
$10.27B was invested in 1695 startup rounds in NYC over the last 12 quarters Tweet this
Key Takeways:
The total amount raised nationally by startups has increased steadily over the last 3 years and has nearly doubled in that same time frame on average. The number of deals have not increased at that same rate which will lead to higher deal sizes on average which will see in a minute.
Tweetables:
$11.2B was invested in Q1 of 2015 in the US in 1205 rounds Tweet this
$98B was invested in 15895 startup rounds in the US over the last 3 years Tweet this
Key Takeways:
New York’s share of the total market has increased at an impressive rate over the last 12 quarters in both metrics being tracked. Dan Primack recently wrote an article about the inflated hype about the New York market and how it wasn’t reflected in the exits. As the trend reflected above continues, and there is continued late stage financings that we saw in the Series C+ slide, Dan will be biting his words and sooner rather than later. Startups are not a race but rather a marathon and the tech ecosystem in New York is still in the early stages of this renaissance.
Tweetables:
Q1 NYC funding rounds comprised 14% of total $ amount in the US with 13% of deals Tweet this
Key Takeways:
Scaling costs money. The average Series A+ round has nearly doubled over the last 3 years in NYC. However, the cost of hustle and getting past that seed/angel stage is negligible as the early stage financing has remained nearly identically over the last 12 quarters. This is also partially attributable to the exponential reductions in the cost of the technology stack.
Tweetables:
The average seed/angel round in NYC in Q1 was $819K Tweet this
The average Series A round in NYC in Q1 was $8.5M Tweet this
The average Series B round in NYC in Q1 was $18.1M Tweet this
The average Series C+ round in NYC in Q1 was $43M Tweet this
Key Takeways:
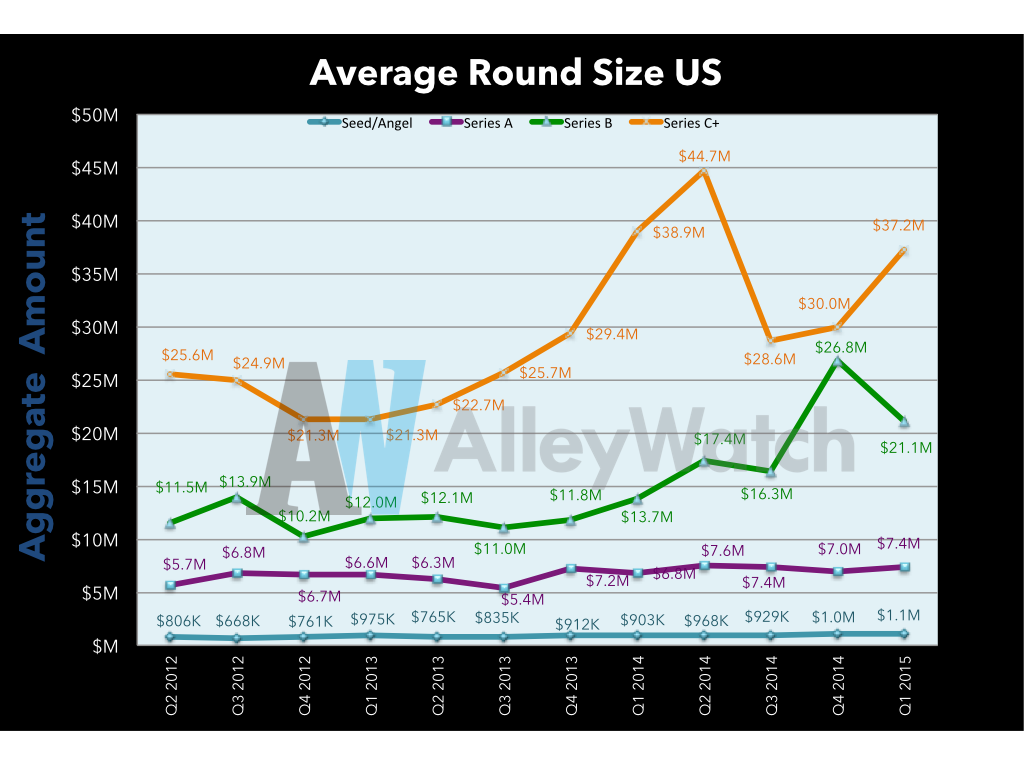
Scaling costs money. This is nearly identical to the chart for NYC. The early stages have remained consistent with there has been at least a 1.5x fold increase in average round sizes past seed. This increase has been more gradual than NYC. One indication may be that scaling a team in NYC is likely costlier due to geographic differences in overhead (rent, facilities, talent, salary, etc.).
Tweetables:
The average seed/angel round in the US in Q1 was $1.1M Tweet this
The average Series A round in the US in Q1 was $7.4M Tweet this
The average Series B round in the US in Q1 was $21M Tweet this
The average Series C+ round in the US in Q1 was $37M Tweet this


