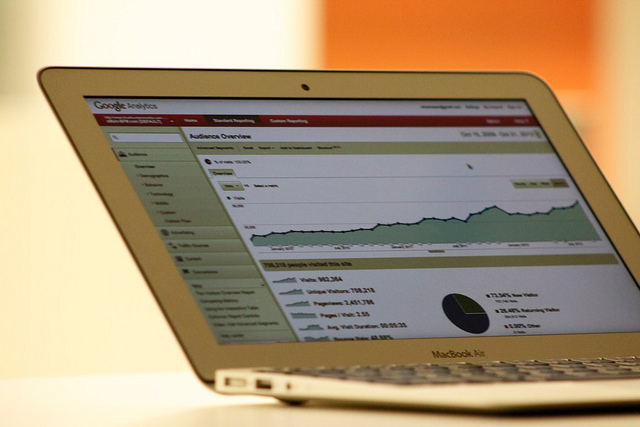
Few will argue that the time metrics in Google Analytics are terribly confusing.
The report includes data concerning “average time on site” and “average visit duration,” however; each metric will paint a very different picture. Which leaves you wondering – which metric is the best one to focus on?
You know the feeling — you get sucked into a report and your “average visit duration” is a mere 40 seconds. You think, “Oh crap!” But then “average time on page” swoops in like a saving grace and boasts an average time of 3 minutes, 9 seconds. Most people would think, “Hmm… I’ll just take ‘average time on page,’ and forget the rest!”
Neither metric is superior over the other. The simple fact is that how they are calculated is flawed and will skew your analysis with inaccurately short or lengthy times. Google looks for timestamps between interactions (pages and events) to calculate these – the difference between the time a person lands on one page and when they move onto the next page.
Google Analytics is flawed in that it cannot capture time on exit pages or bounced visits. That includes the time a visitor spends on the last page that they view before they leave your site, or when visitors only view a single page in a visit. For example, say a person lands on your site and peruses the homepage for 30 seconds before seeing something that sparks their interest, then they spend three more minutes on the next page, but then they leave. The last three minutes they spent reading the site is not captured, as it is on the last page viewed in the visit. The average time spent on site would be reported as 30 seconds.
“Average time on page” does not include exits or bounces in its calculation either. So the time can appear much higher or lower than “average visit duration.” In the previous example, it would be 3 minutes and 9 seconds, telling a much different story than the other metric.
“Average visit duration,” however, does include bounces, but it still cannot determine the actual duration of bounces or exits. So again, this time may appear much lower than “average time on page.” For our example, it would be a mere 40 seconds.
One way to get a better overall picture is through event tracking. By setting up custom event tracking on elements of pages where visitors would click onto, you can gain timestamps on interactions. So if a person viewed only a single page (bounce), yet clicked pieces of the page, the time would be reported as the difference between those interactions and not as a 0 second bounce. However, this would still not be 100% accurate.
Its important not overly stress the significance of time metrics, but rather understand their limitations as you analyze the performance of the site, holistically. The best way to view success on Google Analytics is by focusing on the key actions you want visitors to take. In these reports, set events and conversion goals and strive to meet them. If sales are the goal, then focus on conversion paths and use time metrics to support your argument.
This piece was written by Amber Horsburgh and is reprinted by permission.
Image credit: CC by Blue Fountain Media


